

Acid Test HY05: Stock Performance 0 comments
(P.S: Click on the picture to get a better view
For those who read The Business Times, you will be aware of this journalist Teh Hooi Ling who has a model portfolio of stocks (mostly small-cap) that she regularly compares against the market. (Incidentally, investors should really take a good look at her picks: they're not bad). Although I'm not going to do an every-other-day market comparison of the stocks I've talked about, I thought the end of 2005 would be a good time to look at how my own (anti-)picks have fared.
The acid test of my "not to buy" picks must be medium-term price performance, no matter how well the articles are written or my points argued. Otherwise I would just be another all-talk-no-result DBS analyst isn't it? (ok enough of DBS jokes)
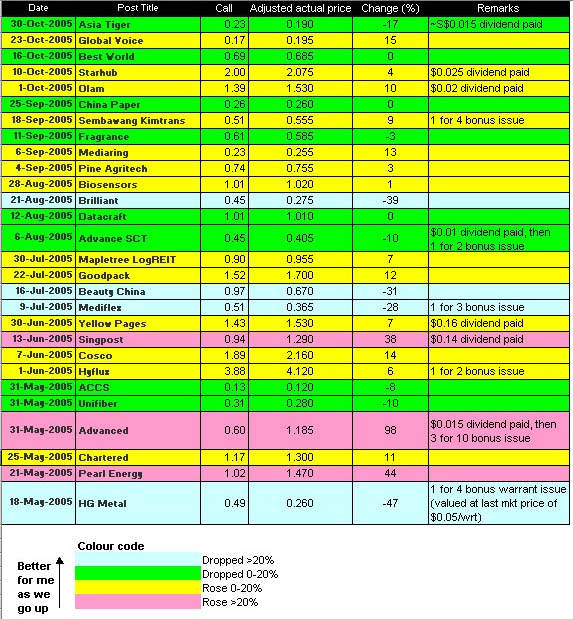
I think to be fair we should look at the stocks covered to the end of October ie. >2 months ago, since we're trying to look at medium-term performance (as what I've always been emphasising). Over this last half year to the end of December 05, I have covered 40 stocks, but the above (arbitrary) criterion would cut it down to 28 stocks. You can have a look at the table above (click on the picture to get a larger image).
Counter-instinctively, a negative price performance by a stock would mean my pick is somewhat vindicated. I have classified the stock performance in four colour codes: blue (>20% drop, which means good with a capital G for me), green (0-20% drop, somewhat vindicated), yellow (0-20% rise, I have to eat my words somewhat), red (>20% rise, which means good with a capital G for those who want to criticise my picks). You will note that I have factored in all dividends and stock splits/bonuses for the corresponding share price since the start of my call on that particular stock.... no cheating there (for if I succumbed to the temptation to omit, it would have been to my great advantage).
Well, if you look at the distribution it appears that the yellow category is most common, 13 of them to be exact ie. quite a few of the "not-to-buy" picks have actually risen, albeit rather mildly. There is a significantly lower number in the green category, 8 of them, which have stagnated (remember that I focus on "hot"/popular stocks) or declined mildly. There is a roughly equal number of "massive vindication" (blue) and "massive egg-on-my-face" (red) stocks, 4 for the former and 3 for the latter (of which Advanced has turned out to be the best stock performer on the SGX for 2005... arghhh).
Well if I can offer some mitigation for the high number of yellow stocks (those with mild rises), it is that (actual or virtual) window-dressing for the late part of December has raised prices quite a bit, and also that as a whole it is inevitable that a rising tide hides those who are swimming naked. The world market is bullish, in particular Asian markets (behold the resurgence of Japan and the continued rise of China and India), and the STI has continued to rise from 2100 in mid-May to ~2350 by end December --- that's a 12% rise excluding dividends.
If we attempt to derive some lessons from the performance on my (anti-)portfolio there are three: firstly, that it makes more sense for me to gun for smaller stocks (as in "not to buy"); secondly, that dividend stocks are resilient; thirdly, that it doesn't pay to go against the (fundamentals-driven) trend. The first point is clear: those in the yellow category (ie. whose prices have risen) are relatively larger-cap stocks (eg. Olam, Starhub, Yellow Pages, Cosco, Hyflux, even Chartered) with institutional followings; there has been price support. There are the glaring exception of the twin Internet stocks of Global Voice and Mediaring of which I am still not convinced as of today. Those whose momentum has stalled (green category) are generally smaller stocks which are more susceptible to price retreat once retail buying interest subsides (eg. Best World, Advance SCT, Unifiber). The second point is somewhat related to the first, since it is the bigger companies that tend to pay out regular dividends. On a total-return basis, for example, Yellow Pages has turned out to be slightly positive because of its high dividends, as indeed has Starhub and Singpost. For indeed there are the income funds which still place great premium on yield stocks, despite their low growth potential (as perceived by me).
The third point relates to the twin glaring stocks of Advanced and Pearl Energy. The oil and gas craze has driven the prices of these two stocks, the former in particular, way above what I initially considered fair value. Well, I have always talked about trendspotting, so I guess their prices followed the fundamentals-driven trend and I should not be overly surprised. It appears I have not learnt my lesson for my two most recent "not-to-buy" picks have been another two oil and gas stocks: SPC and Technics. Haha, we'll see how they fare. For SPC I do see a softening of the trend of rising margins, while for Technics it's based mainly on valuation issues.
At the end of the day, the above comparison has just been an academic exercise or an exercise in personal vanity/personal humiliation. The stocks I have discussed would have done better or worse at various times during the last few months due to price fluctuations so such a static snapshot comparison somehow takes the dynamics out of things. Yet the key risks (industry, company, valuation) to the particular stock are still there and these should be what I hope to highlight and bring across in my blog articles. At the end of the day I still hope for the rising tide to continue despite its probable negative action on my "anti-portfolio"; for after all, it's likely to have positive action on my real stock portfolio.
posted by DanielXX at 9:31 PM
![]()
0 Comments:
Post a Comment
<< Home